Diagnosing the Spinning Cursor on a Cold Desktop
A workstation sits powered off overnight. The BIOS handoff completed around 45 to 60 seconds prior, leaving a cold boot state where the page cache sits close to 0 bytes. You click a Snap-packaged editor. The cursor spins. On the exact same machine, a Flatpak browser launches by reading objects directly from the disk. The delay you experience immediately after power-on comes down to a specific hardware tax. You are paying for SquashFS decompress-on-page-in on the CPU, or you are paying for scattered OSTree object reads on the drive.
Three factors dictate this launch window. The first is an empty page cache forcing physical hardware access. The second is the specific compression codec applied to the SquashFS image. The third is whether the Flatpak content exists as plain checked-out files ready for immediate access. Understanding this interaction requires looking past the application itself and examining how the kernel moves bytes from persistent storage into executable memory. The visual feedback of a spinning cursor masks a complex negotiation—one strictly between your storage controller and your processor.
Tracing the SquashFS Loop Mount Penalty
The Snap execution path relies heavily on kernel-level filesystem features. The system mounts a loop-backed SquashFS image containing the application and its dependencies. When the application requests libraries and assets, the kernel demand-pages those compressed blocks. Heavy xz-style compression trades smaller file sizes for intense CPU work at first page-in. The processor must inflate every block before the application can execute the instructions inside.
You can observe this hardware strain directly. A quick check with pidstat showing roughly 100% utilization on a single core for the squashfs/loop path while disk I/O remains below 5 MB/s confirms a processor bottleneck. The storage drive sits mostly idle waiting for the CPU to finish unpacking the data. Rebuilding a snap with a faster codec such as zstd shifts that balance toward cheaper decompression, allowing the drive to feed data faster.
After a cold boot, there is no warm buffer cache to save you. Every initial read forces a decompression cycle. The Linux kernel SquashFS documentation details the block layout that drives this behavior. The kernel allocates a buffer, reads the compressed chunk from the disk, decompresses it into another memory page, and finally hands it to the application. This multi-step process happens for every single file the application touches during startup.
Isolating the Cold-Cache Variable
Testing Warning: System administrators frequently misdiagnose slow application launches by ignoring the state of the page cache. A warm cache serves files directly from RAM, completely bypassing the decompression penalty. Evaluating packaging formats requires a strict testing environment where the cache is explicitly cleared before every single measurement.
Mapping OSTree Object Reads to Drive I/O
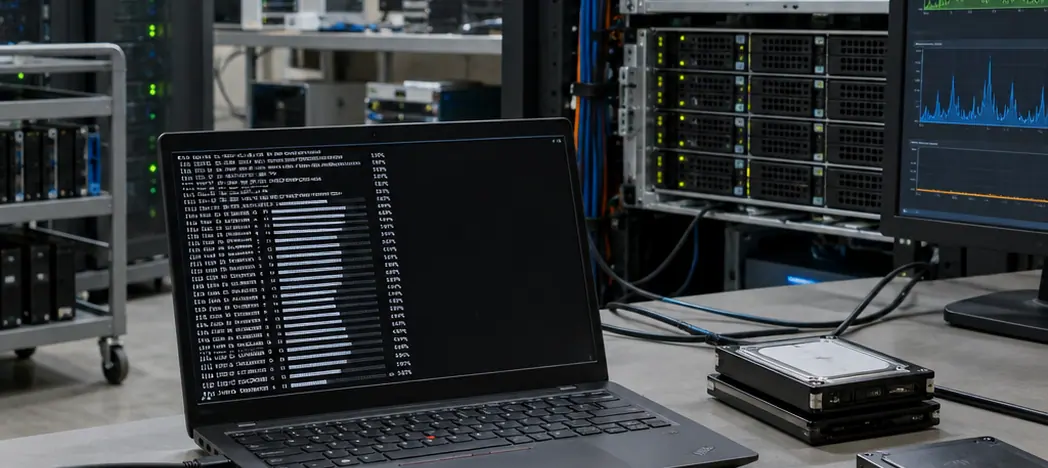
Flatpak takes a fundamentally different route through the storage stack. The OSTree mechanism relies on content-addressed objects, checking them out or hardlinking them into the application runtime. Launching the application triggers ordinary file reads. This avoids a massive decompression tax because the files sit uncompressed on the disk.
A cold boot still incurs a penalty if the object store fragments across the drive. The I/O shape looks entirely different from a loop mount. The system executes thousands of inode and extent lookups followed by payload reads ranging from roughly 4KB to 16KB. During this phase, iowait climbs above 30% while user CPU stays under 10%. The processor spends its time waiting for the storage controller to fetch scattered metadata and small file chunks. The hardlink farm structure means the filesystem must traverse multiple directory levels to resolve the actual physical location of the data.
This specific profile assumes desktop environments utilizing local NVMe or SATA SSDs rather than network-mounted home directories. A fast local SSD handles high queue depths and random reads efficiently. Introducing spinning rust or NFS-mounted home directories fundamentally alters which I/O path bottlenecks first. Mechanical drives struggle with the random read pattern generated by OSTree, often causing the launch process to stall completely while waiting for disk seeks.
Shifting the Bottleneck Between Processor and Storage
The choice between packaging formats creates a moving bottleneck. Tighter compression on a Snap SquashFS image forces a fast NVMe drive to wait on the processor during first launch. Looser codecs make that same machine wait on the storage controller.
Initially, the testing methodology relied on simply closing and reopening the application to measure launch times. This approach was discarded because it only measured the warm-start path where assets were already in the RAM buffer cache. The procedure was revised to mandate a forced drop of the page cache before every measurement to accurately capture the cold-boot decompression penalty. Re-timing first window paint after clearing the cache reveals the actual hardware cost of the packaging format.
Flatpak and OSTree packing choices primarily affect download times and disk footprint. The click-to-window path remains largely unaffected unless the checkout itself remains packed and requires inflation at first use. The system simply reads the files it needs. Tuning a system based on folklore often leads to wasted effort. Changing only the Snap compression without dropping caches and re-timing first window paint will measure the warm-start path you do not care about after a real power-off.
Benchmarking Your Own Desktop Launch Times
You can map this behavior on your own hardware using a straightforward procedure. The decision to use pidstat over standard stopwatch timing was made to isolate the exact subsystem causing the delay. By watching user CPU and I/O wait concurrently during the roughly 10 to 15 second launch window, the bottleneck is explicitly identified as either SquashFS decompression or OSTree object reads.
- Establish the baseline: Pick one installed Snap application and one installed Flatpak application that you actually click after login. Close both applications and sync your disks. Drop the page cache via echo 3 > /proc/sys/vm/drop_caches so the next launch mimics a cold-cache power-on state.
- Monitor the launch: Start pidstat watching user CPU and I/O wait. Launch the Snap application and record the time-to-first-window by eye or with a simple wrapper script. Monitor the %usr and %wait columns in the pidstat output to see whether the CPU approaches 100% or the I/O wait spikes.
- Reset the environment: Reboot the machine or drop the caches again using the exact same sysctl sequence to ensure the next test starts from zero.
- Compare the storage paths: Repeat the launch and measurement process for the Flatpak application. For example, a Snap run near 100% user CPU with disk I/O below 5 MB/s points to decompression, while a Flatpak run under 10% user CPU with I/O wait above 30% points to scattered OSTree object reads.